The NBA offseason raised a few questions. In order to answer these questions I need to do a little research and figure out a few things. One of these things is an aging curve for basketball players. What is their prime? What rate do they decline after that prime? Luckily this question has been asked and answered in baseball so I can use their methodology and apply it to basketball.
For data, I went to www.basketball-reference.com and pulled the advanced data for players from the 2000-2001 season through the 2009-2010 season (the seasons from the last collective bargaining agreement). My methodology follows the work of TangoTiger and MGL, particularly this article written by MGL. I will try to briefly summarize the methodology. MGL offers a much clearer explanation so I recommend reading that article first.
The stat I relied on was Win Shares (WS) per 2500 minutes. The 2500 minutes is an arbitrary figure. I compared each player's WS -per-2500 minutes with their next season season to arrive at a difference in WS between the two seasons. I then averaged the delta to arrive at a rough win curve. For example Lebron James had a WS-per-2500 of 4 in is age 19 season and 10 in his age 20. 10 - 4 = 6 for a delta of 6. This delta is then compared to all the deltas for people in their age 19 to age 20 seasons.
It is a little more subtle than that. One concern is survivor bias. Survivor bias (read the MGL article) is the idea that the sample is biased because the people who survived to play another year are a biased sample. Say there are two players who have a WS of around 2 and that due to random factors they can fall up to 3 wins shares around that average. Player 1 gets lucky and gets 3 WS worth of random factors that help him and Player 2 gets unlucky and has -3 worth of WS befall him. Despite Player 1 and Player 2 being the same skill level, Player 1 has a 5 WS season and Player 2 has a -1 WS season. Player 2 is cut and does not play next season. Player 1 does get to play another season but is likely to regress from his lucky season of 5 WS to his mean WS of 2. This survivor bias influences the sample. To prevent this, players who do not have a next season have to have one projected for them.
I followed the MGL method for projecting seasons for players who did not have a next season. I averaged their last three years of WS per 2500 and regressed that with the league average WS per 2500 for someone that age; less -.5 WS. The -.5 is another arbitrary figure. This is a conservative prediction for a future season.
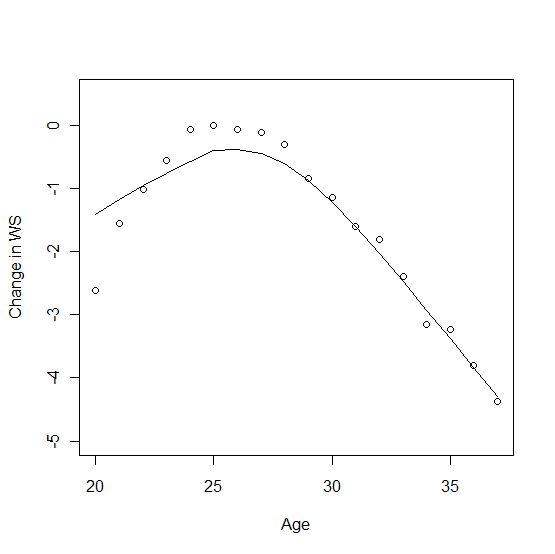
Another issue, and one I struggled with, is how to weigh the data points. Should I include all players, even those who played less than 5 minutes a game? If so should I weigh the data points of players who played more higher than those who played less? In the end I included all players and weighed each of the data points by the amount of time that they played. For example if a player played 3000 minutes and year one and 2500 minutes in year two and another player played 400 minutes in year one and 1200 minutes in year two, then the former player's results would be carry more weight. The results:
Age 25 is the peak of the graph. There is not much difference between Ages 24 - 28. Players tended to improve until Age 24, then plateau until 28 or 29 before declining by about .5 WS per year. For some perspective, WS in general peak in the Age 26-28 years.
I am not really thrilled with my process or results. Some of my assumptions are a bit too arbitrary for my liking. To feel more comfortable with my results I would have to research this further, taking a closer look at players year-by-year and in different segments to get a better feel for the data. However for the purposes of my original problem, the decline of -.5 WS per 2500 minutes per year after the age of 28 will suffice.
Subscribe to:
Post Comments (Atom)

No comments:
Post a Comment